In this Office 365 article you will learn how to enhance how you play the Great Game of Business and get beyond traditional desktop tools like Excel for financial forecasting and scoreboards. Open Book Management is a powerful tool to grow profitable businesses that benefit all employees and stakeholders. At the core is financial literacy, which includes weekly financial forecasts that are reported in weekly huddles and presented on white boards, so everyone can follow the action and keep score to know if they are winning or losing the game of business.
We will teach you how to use financial data from accounting and merge it efficiently with weekly forecasts from the departments and teams in the game. Learn new tips and tools to automate the busy work using technology that is cost effective and you probably already own such as Office 365 (O365), SharePoint, Power BI, and others to make amazing and insightful financial dashboards.
What You Will Learn
- Why automation might enhance the game
- Common workflows used in weekly scoreboard and huddle activities
- Who benefits from automation
- Tip 1 – Office 365 for Excel
- Tip 2 – Office 365 SharePoint
- Tip 3 – Power BI Scoreboards
- Tip 4 – Systems Integration
Why Automate
We know sharing financial data is a big deal. Financial literacy can change your company. Ask yourself these questions:
- Is our financial forecasting efficient?
- Is our financial reporting secure?
Business benefits of automation may include:
- Reduce the necessary level of effort = productivity, efficiency, speed
- Reduce errors = credibility, trust, quality
- Widely distributed information = adoption, empowerment
- Visualization = insight, meaning, trends
- Better results = profit and bigger bonuses
- Cultural fit – mobile, tech-savvy users may prefer digital scoreboards
Common Financial Forecasting Workflows
In many organizations we see the financial reporting and forecasting working something like the follow. How does it work in your company?
- Actual financial results are reported weekly, monthly, quarterly, and annually from the accounting team using the financial management system.
- Export financial statements to Excel for:
- Profit & Loss reports
- Income Statements – cash flow
- Balance Sheet statements for assets and liabilities
- Staff and teams update and reforecast critical numbers in Excel
- Teams review and approve the forecasts
- Huddle – teams post the forecast and actuals on a Whiteboard physical Scoreboard in a team room
- Everyone follows the action in the weekly and monthly huddle
- Optional – some teams project the Excel forecast onto a projector screen for the huddle

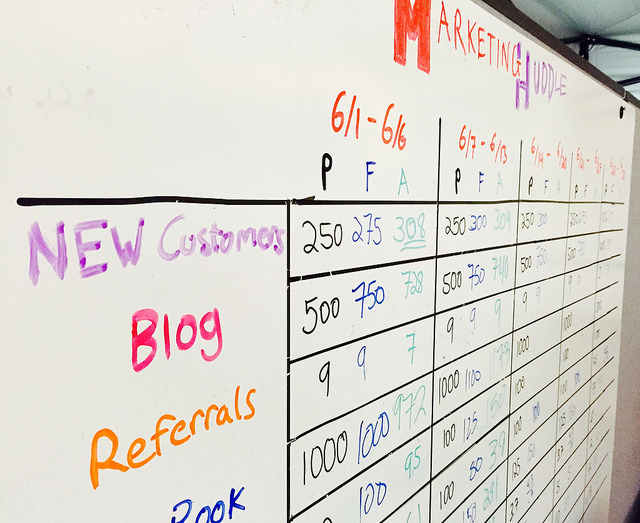
(See this example of a live Huddle and Score Board on white boards in a team room)
Who Benefits from Automation?
There are a number of people and departments groups that can be big beneficiaries of automation tools, that go beyond the business benefits listed in the introduction. We find the following groups have a lot to gain:
- Financial Department – if automation can help with the work associated with weekly financial reporting and distributing that information across the company, that would help lighten the load often placed on the finance team
- Forecasters – each of the employees responsible for forecasting a critical number and streamline the time they spend analyzing and updating their forecast if the data and reporting was automated at some lever. Also, the teams and managers that help collaborate to review the forecast can streamline the steps using software automation in many cases.
- Everyone – all employees across the company can using digital score boards to follow the action and carry the information around with them on their devices, or project them on screens around the facility so the data is available everyone, any time, from any location, not just those in the break room where the white boards are
Tip #1 – Office 365 Excel Online
Our number one recommendation for automation is to move from Excel on the desktop or laptop, and shift to using Office 365 version of Excel that works on a web browser or mobile device. Here are some things that are possible with Office 365 Excel online:
- Co-Author in Excel – you can have many simultaneous users working in the same spreadsheet document. This allows for parallel workflows not sequential routing of documents and versions.
- Entire team or company can be reading off one spreadsheet
- Works in a Browser/App/Device
- Anywhere access
- Collaboration with teams and reviewers can post notes, write comments, or share information
- Example – finance can send out the updated actual data with the old forecast. Everyone in the company can review it and update their numbers in one spreadsheet
- Tutorial – watch this short 0:48 Second Tutorial on how it works >>
Do You Own Office 365?
Here is how you check:
- Go to http://office.com
- Login with your company username and password you use at work
- If you can login, you have Office 365! If you cannot, you can ask your IT department to purchase it for you. It costs about the same as the old desktop office license
- Do you see Excel or SharePoint on the list of Apps like shown here? If so, you’ll want Excel and SharePoint for the rest of this User Guide

Tip 2 – Office 365 SharePoint
SharePoint is a powerful tool that you probably already own if you have Office 365. It comes free with the Enterprise license. Here are some great ways you can use it to help manage and optimize and automate the business processes that deal with financial data and financial cost management.
- SharePoint is a website with document libraries and data views
- Perfect for company financial processes
- Financial actual data could be published to SharePoint List
- Forecasts could be updated on a SharePoint List
- SharePoint even syncs with Excel
Take a look at some examples below.
Project Scorecard – if your company bundles work into projects, keeping project costs under control is key to financial success. On this score board you can see how the team tracks:
- Project Budgets
- Forecast Hours
- Actual Hours
- Master Schedule Dates by Phase
- Actual Dates (because on schedule often means on budget)
- All the ingredients required for Job Cost data
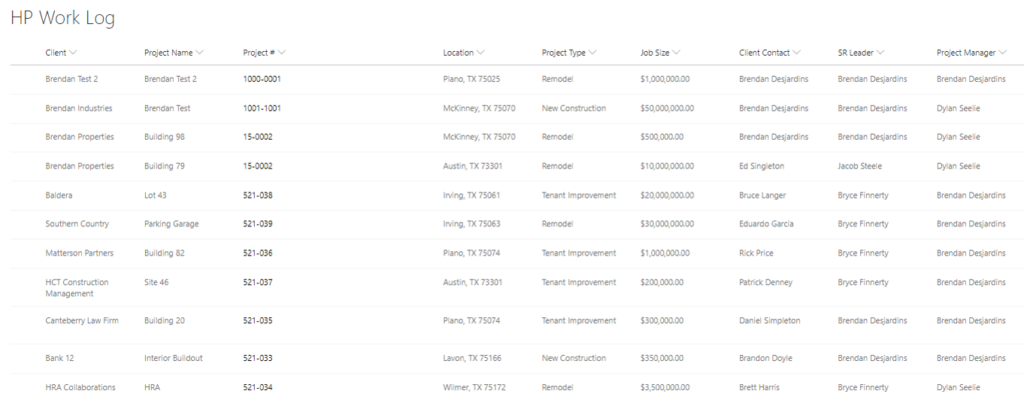
Here is an example of Project Tracking SharePoint data list the company uses to track all high level project costs. See the Project Numbers, Job Cost Codes, and other information needed to tie Projects to Financials.
Here is an example of tracking specific time for tasks for employees and contractors. SharePoint can have forms and lists on the same page, making it simple to track and manage time reporting and actual hours spent vs. forecast hours.
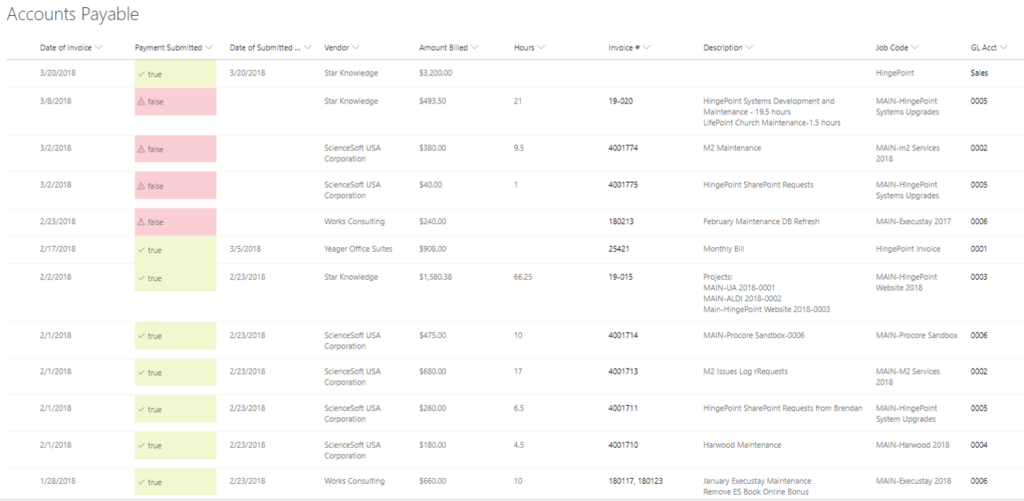
In this example we track all the invoices for accounts payable to sub-contractors and accounts receivable for us to bill our clients for our work. This AR/AP SharePoint page helps manage the workflow of authorizing work, getting business sign off, and collaborating with accounting on what invoices to send out and what invoice to pay. This streamlines the AR/AP process across the company. We track the hours, and costs billed to each project.
Tip 3 – BI Scoreboards
- BI = Business Intelligence – and it is a type of software automation tool that helps people understanding the Score Board information and what it means
- Helps with Financial Literacy and rolling out open book management
- Analytics help you to analyze the data, ask it “what if” questions, or to spot trends and outlier costs
- Solve problems using data by researching the detail behind the numbers
- Works on mobile devices, is usually dynamically updated and is secure so only the right people see the right data
- Drill down, roll up, slice and dice data in new ways not possible before, at the click of a button or filter
- BI tools are built on Excel, SharePoint and other systems of record
- Microsoft Power BI or Tableau are the 2 most commonly used BI tools
Here are some examples of how you can use BI Tools to create new Scoreboards for the huddles in the Great Game.
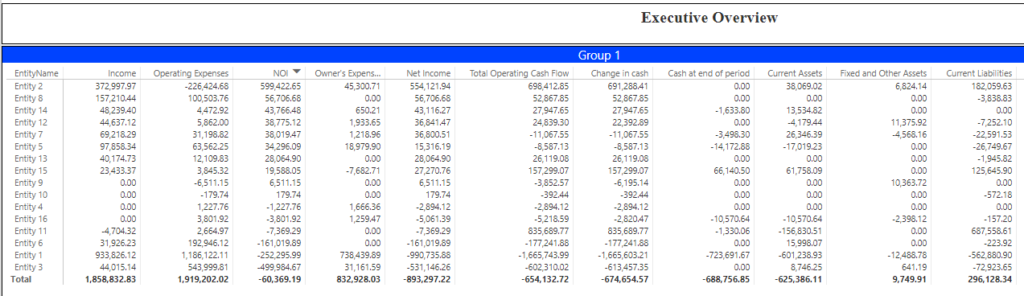
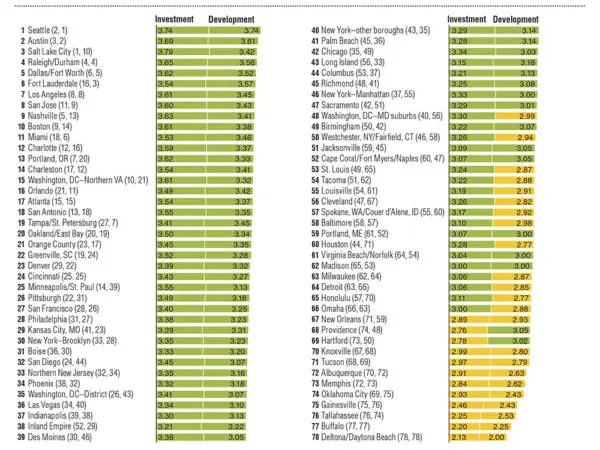
In this example the executive view combines all the financial metrics a leader wants to see from the Profit and Loss statement, Balance Sheet and Income Statement. You can also roll up a number of projects, entities, or in this case, real estate asset entities. This is very powerful because it pulls from multiple General Ledgers to roll them all up together across a portfolio of investments.
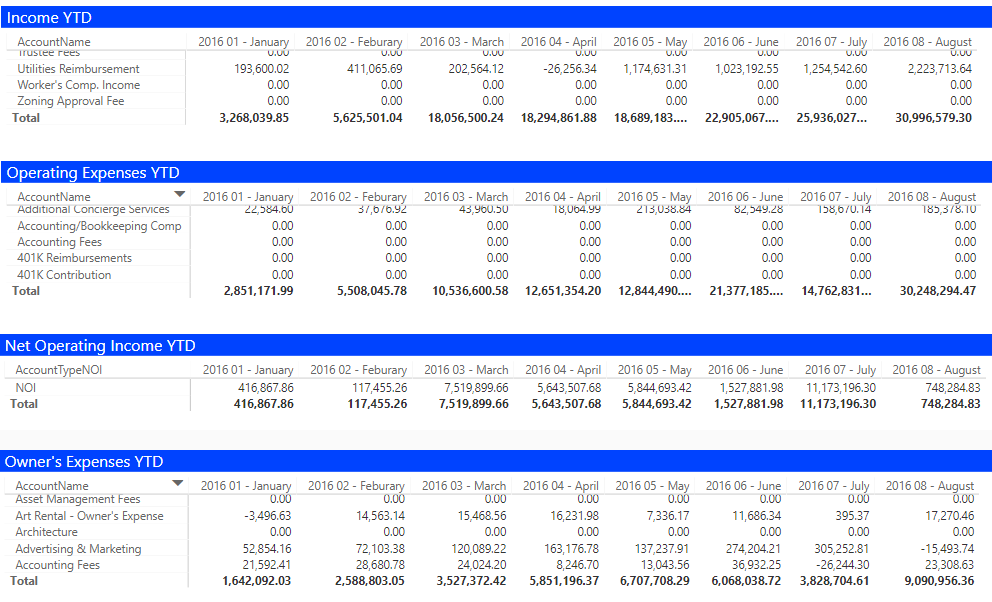
In this example you can see all the accounts and categories for the financial statements compared to Year to Date so people can quickly verify where they are in their budget. Summaries are by Month of the Year.
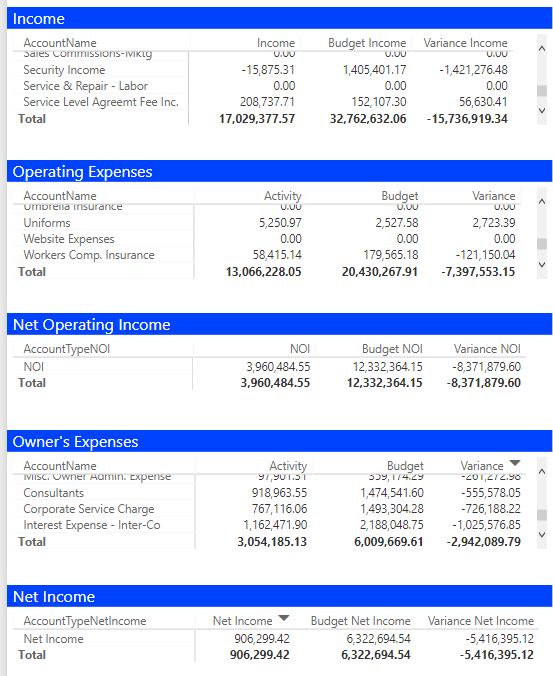
In this example we see a roll up of all costs for all financial statements, and compared against the forecast. It reports on the Variance from plan and alerts you immediately to any issues across the full suite of financial metrics, all on one screen.
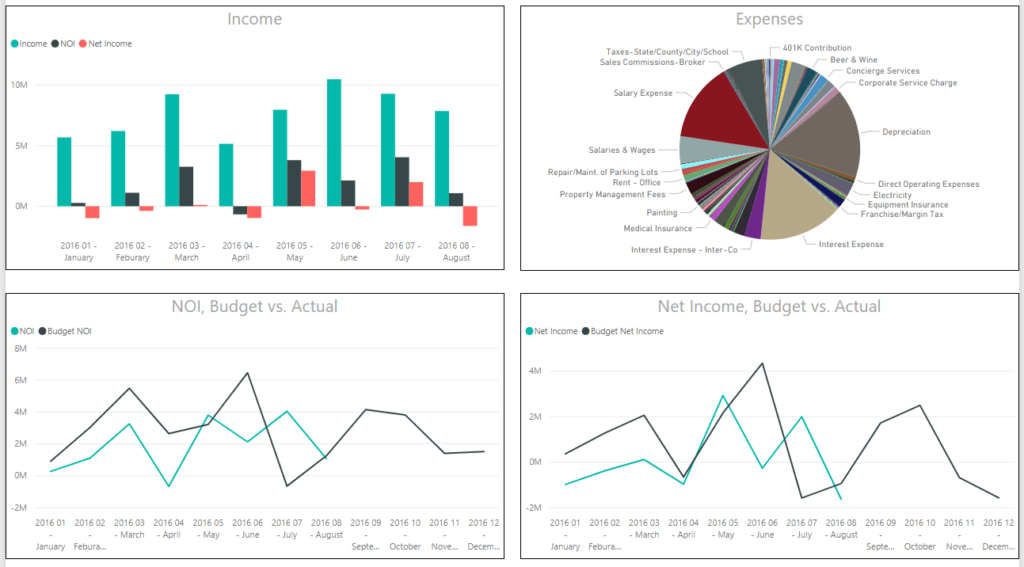
In this example you can see graphics and dynamic data that you can interact with across all the graphics for:
- Income by month and income metrics
- Expenses by category for the time period
- Net Operating Income vs. the forecast, by month
- Net Income vs the forecast by month
Here you see clear visual trends that tell a story and communicate if you are “winning” at a glance. These graphics can steer you immediate to the important trends, success, and problem areas in your business.
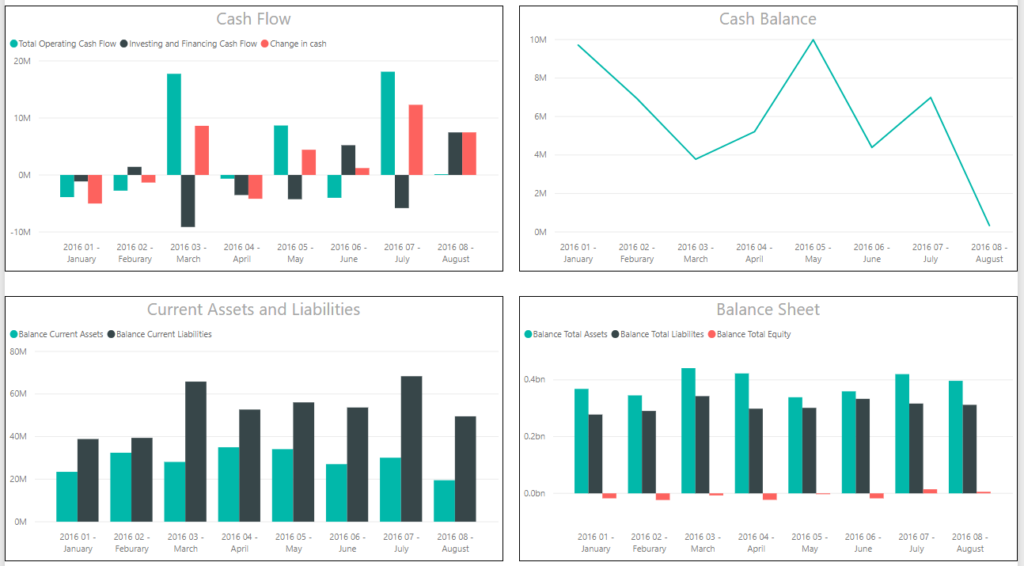
In this example the Scoreboard shows more financial metrics and trends for:
- Cash Flow statements by month
- Cash balances – cash is king! Follow the trends carefully
- Assets and Liabilities by month
- Balance Sheet by month so you know where you stand at all times
Imaging the possibilities if all employees had this information at all times on their laptops, tablets and mobile devices. That would be financial literacy at its highest level.
Tip 4 – Systems Integration
- Use software to process data and share it across the job functions that need it
- Eliminate manual data collection and analysis
- Let the computers do the busy work and the people play the game
- Get systems to “talk to one another” to eliminate redundancy
- Tip – only 1 System of Record per piece of data
- Tip – Data should only be entered once in a company or it should be automatically captured and output from existing processes and tools
Leading Indicators can be pulled for mini games to improve financial performance. Here are some recommending leading indicators from Great Game coaches:
- CRM – marketing funnel data – integrate with your CRM and marketing platforms to track, report and manage information such as:
- Impressions
- Clicks
- conversions
- touch points
- trade shows
- leads
- Sales – sales data can tell you a lot about the future. If you aren’t selling the future is bleak. If the sales funnel is healthy and growing, you may be on a financial upswing in revenue. Track some of these metrics:
- sales qualified leads
- appointments
- proposals
- RFQs
- bids
- Project Management + Financials = job cost control. Integrating project management and project job costs is critical.
- 1 Way Sync – Push data out of system automatically to another system so you can share the data across the enterprise, but you don’t have to pay more for more licenses of the software. This saves money in the long run.
- 2 Way Sync – Push and pull data in and out of systems automatically. This is when systems “talk to each other”. They are smart enough to send data out, let other review and approve it, and push the data back, with no manual work needed. This is very efficient and cost effective, and gets costs down to pennies per transaction.
THE END
If you want to learn more about financial scoreboard automation:
www.hingepoint.com for more information
About HingePoint
HingePoint offers cloud and mobile applications for construction and real estate that are easy to adopt and employees love. Specializing in the systems that run the construction and real estate business including SharePoint, Salesforce, Procore, MS Dynamics, Power BI, Microsoft Azure, and more. Scale and grow profitably with Financial and Project Management Dashboards with SharePoint, document management with SharePoint, and workflow automation for field to office collaboration.
HingePoint
8105 Rasor Blvd.
Suite 241
Plano, TX 75024
(214) 301-0000
www.hingepoint.com