Failing to properly utilize your business information will make or break your competitive advantage
Common Problems

You’re spending too much time collecting data for analytics in SharePoint.

SharePoint users are struggling
to access relevant business data.

Your SharePoint lacks visuals, dashboards, and reports for key stakeholders.
Discover the “why” behind the data
Don’t just know what’s happening, discover the “why” behind you data when you upgrade your decision-making with a SharePoint + Power BI integration from HingePoint.
After we help you integrate your disconnected data streams into auto-generated reports and easy-to-read visuals with Power BI, your team will gain more insight and greater confidence.

It’s your data, and your team needs it now.
Take full advantage of your data when you work with our team of experienced SharePoint and Power BI developers.
- Automatically integrate all your data in one place
- Auto-update and synch your data so it is always up to date
- Great graphics and dashboards to show you data trends, forecasts, and intelligence
- Interactive data, filter, sort, What IF questions, toggle and pivot your data at a click
- Export data to Excel from ad-hoc reporting
- Standardize reports, dashboards, and formats of data
- Auto-generate reports and send them to your users for quick collaboration, saving tons of busywork

Why Work with HingePoint?
Experience

We have 15 years of experience with SharePoint and have helped over 100s companies with SharePoint and Power BI solutions
Unique Process

Our unique process ensures that you get visual dashboards you need in a way that works works for you
Results Guaranteed

We are the only company in the industry that offers a results-based guarantee
SharePoint + Power BI Integration Case Studies
![]()
M2 Services – integrated over 50 dashboards into SharePoint, that was pulling data from across 4 enterprise data sources
![]()
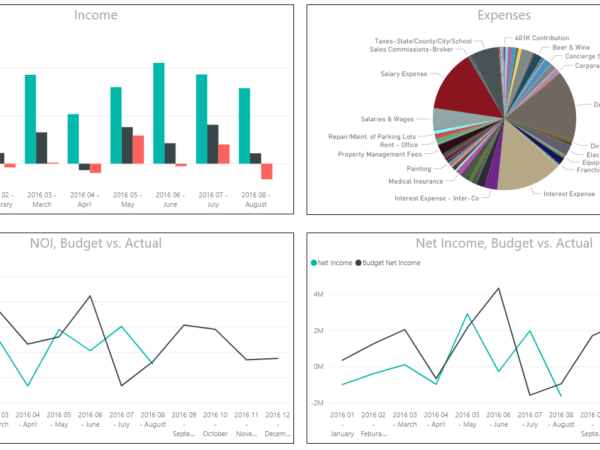
Gordon Highlander – Construction project management, pulling data from PM and Financial data from a project financial dashboard
![]()
Harwood – integrated 53 company financial systems into a Portfolio view of all standardize financial data across Profit and Loss, Cashflow, and balance sheet reporting
![]()
Greystar – developed automated system to pull data from enterprise reports, plus developed visual dashboards pulled from 4 enterprise systems globally
Frequently Asked Questions (FAQs)
Related Blog Posts
HingePoint's Roadmap for a Successful Deployment

Analysis & Scoping
We scope the solution to your specific requirements, budget and timeline. Tailored to you.

Design & Develop
We’ll work with your key stakeholders to create and/or integrate solutions that achieve your business goals.

Test & Deploy
We fully test, secure, and deploy your solution. Training users to maximize adoption and enjoy the benefits.