We believe problems are there to help us grow and find a better way.
Key Benefits to Working with HingePoint
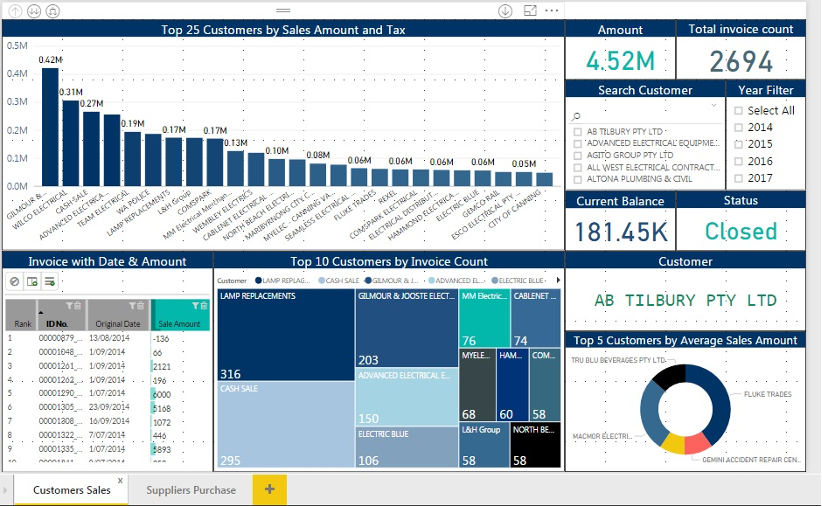
See Trends, Dig Deep
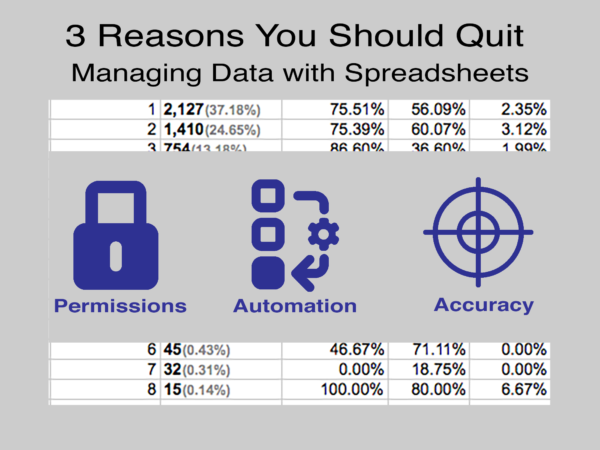
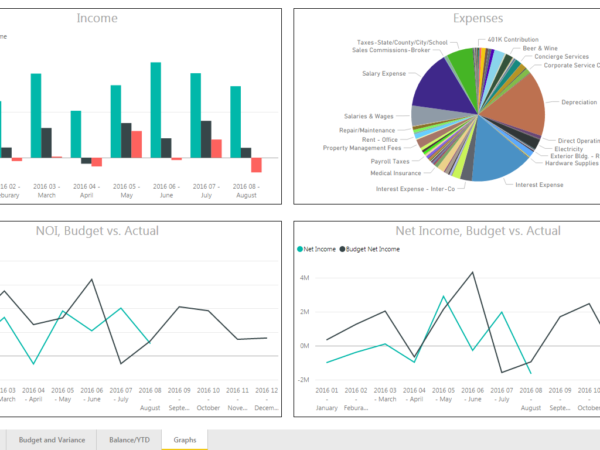
View the performance of the whole company or individual entities within it. Get more detail by drilling down into individual segments. See trends over time with charts showing performance across months, quarters, or years.
Quit Doing it Manually
Automated graphs and reporting saves you time and effort. Instead of manually creating reports, simply load the data into the Dashboard and reports are generated automatically and visually.
Report Data Instantly
Visualizations are available at the touch of a button. No more scrolling through long lists of numbers. Spot trends, compare across entities and periods and identify problems and opportunities quickly and easily.
Why do I Need Power BI & SharePoint Consulting?
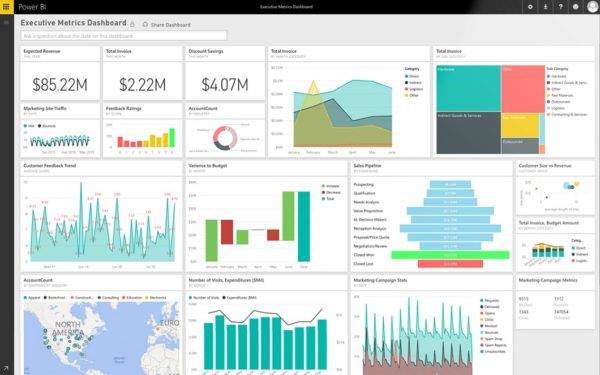
If you can’t see the whole picture about your business, then you’re probably unsure if you’re focusing on the right priorities. You probably cannot immediately see and understand trends from your data.
With Power BI and SharePoint consulting from HingePoint, you can take the blindfold off, and see your data organized visually on one screen, instead of scattered across spreadsheets, software and organizations.
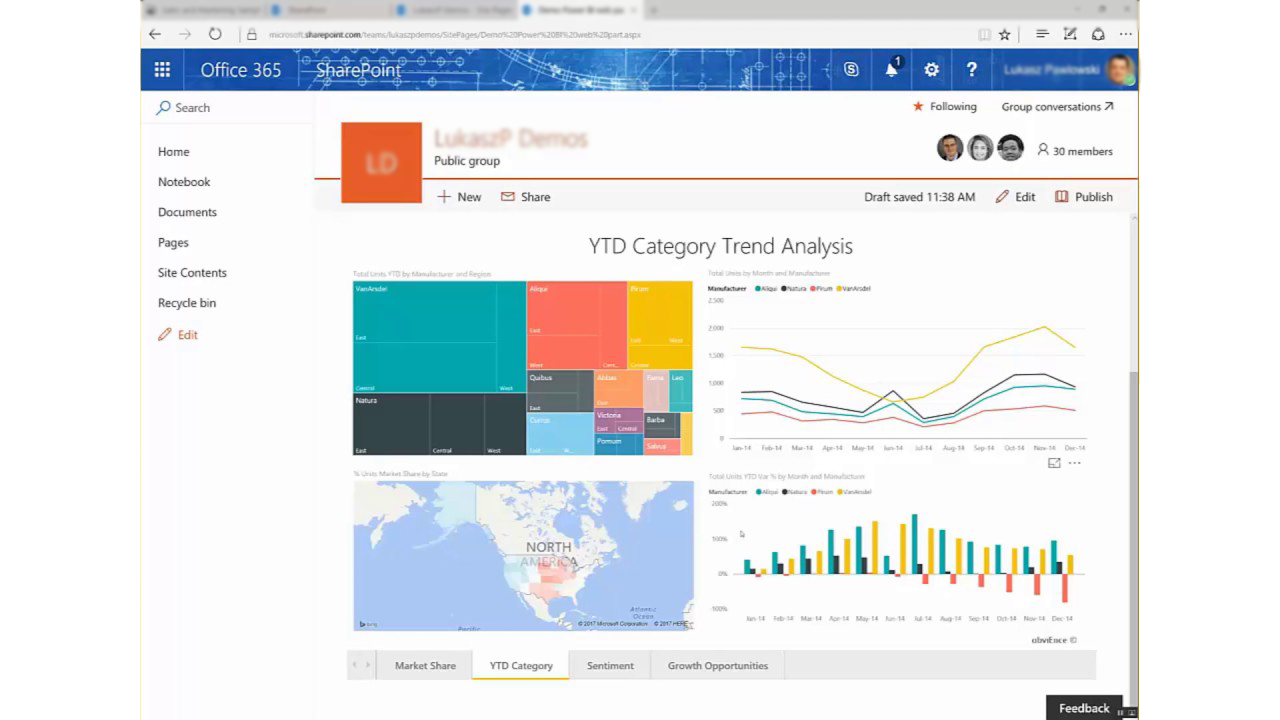
How Will Power BI + SharePoint Transform My Business?
Power BI and SharePoint are proven tools that benefit other businesses, but how will they benefit your business?
We’re guessing you would like more than just a generic overview. When you’re ready to transition to better data-driven decision making through powerful dashboards, reports, embedded analytics, self-service analytics, and visual analytics our Power BI Consultants are here to help. We have a simple 3-Step Process to get your project completed on-time and within budget.
Why do we need Power BI reports and dashboards?
- Data Source (Fetching data in Power BI)
To fetch data from various data source can be the first and foremost challenge that can be faced in Power BI.
- Data Validation/ Data Structure
Another difficulty that can be faced in Power BI that is faced is Data validation. We need to have proper data structure so that Power BI can use that data appropriately. If the data structure is not as per the requirements there can be issues faced for fetching proper data as per requirements. For example, fetching data from excel that is not as per the appropriate data structure etc.
- Attractive designing (Look and Feel of reports)
This is the Key part for any Microsoft Power BI project. Attractive charts and reports as per the expectations are the foremost need of any clients.
- Easy search and Filter (ease of data viewing)
Filter the data with ease is another specific requirement.
5. Auto Refresh (Automatically refreshing charts)
Refreshing the data automatically is one of the challenges that is faced in Power BI.
HingePoint's Roadmap for a Successful Deployment

Analysis & Scoping
We scope the solution to your specific requirements, budget and timeline. Tailored to you.

Design & Develop
We’ll work with your key stakeholders to create and/or integrate solutions that achieve your business goals.

Test & Deploy
We fully test, secure, and deploy your solution. Training users to maximize adoption and enjoy the benefits.