We believe problems are there to help us grow and find a better way.
Harnessing SharePoint for Effective Financial Reporting Solutions
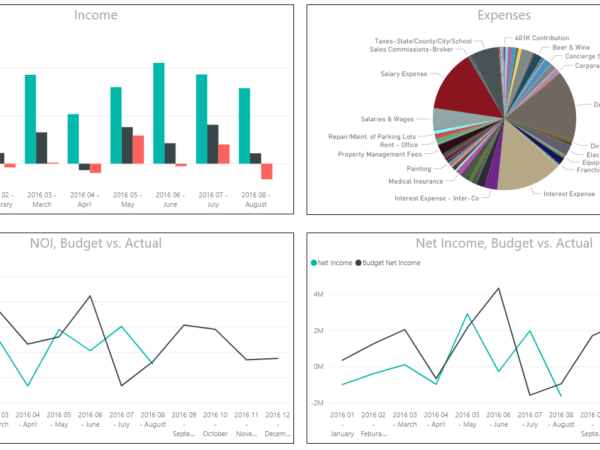
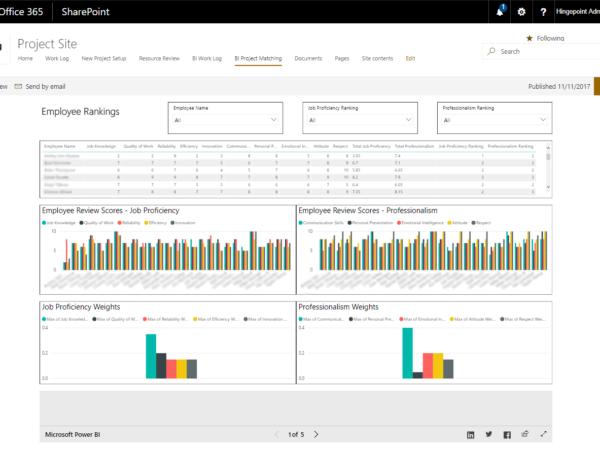
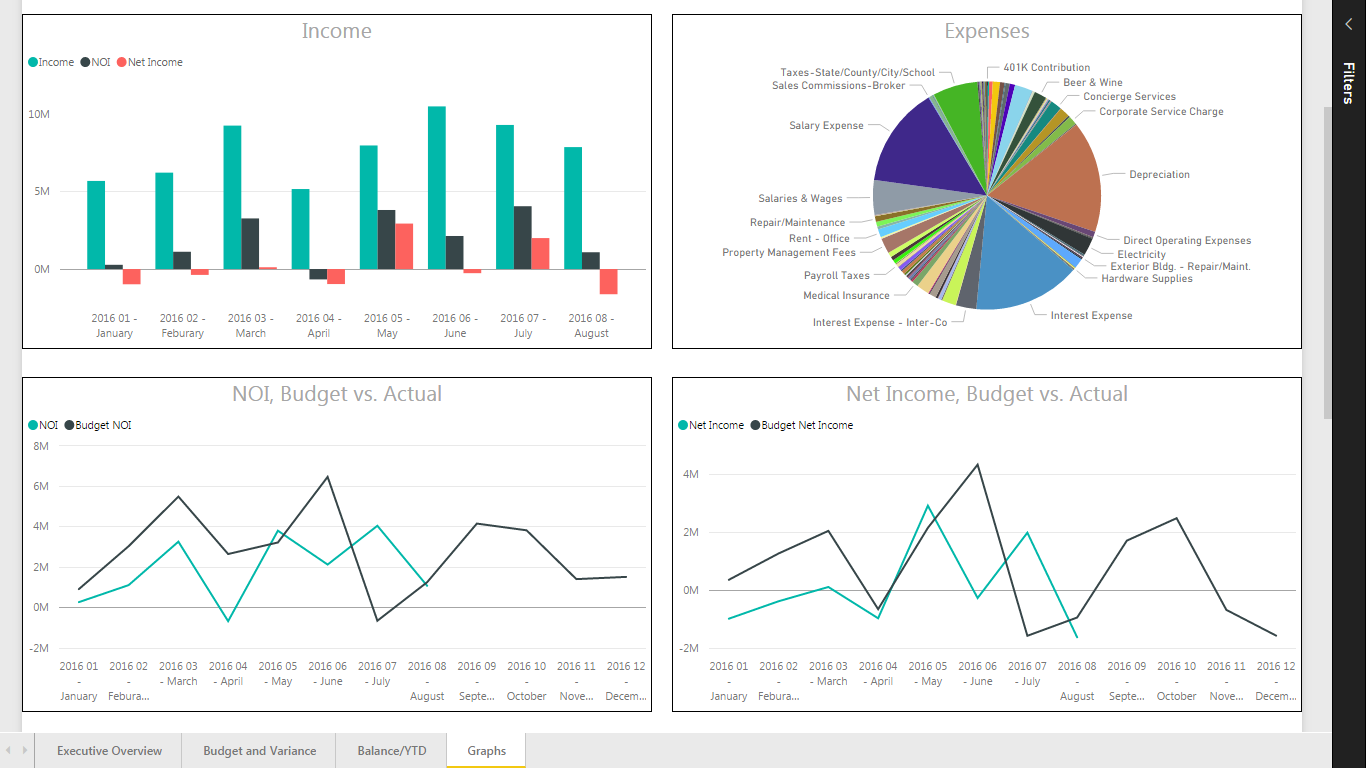
Visualize Trends and Insights with SharePoint-Powered Dashboards
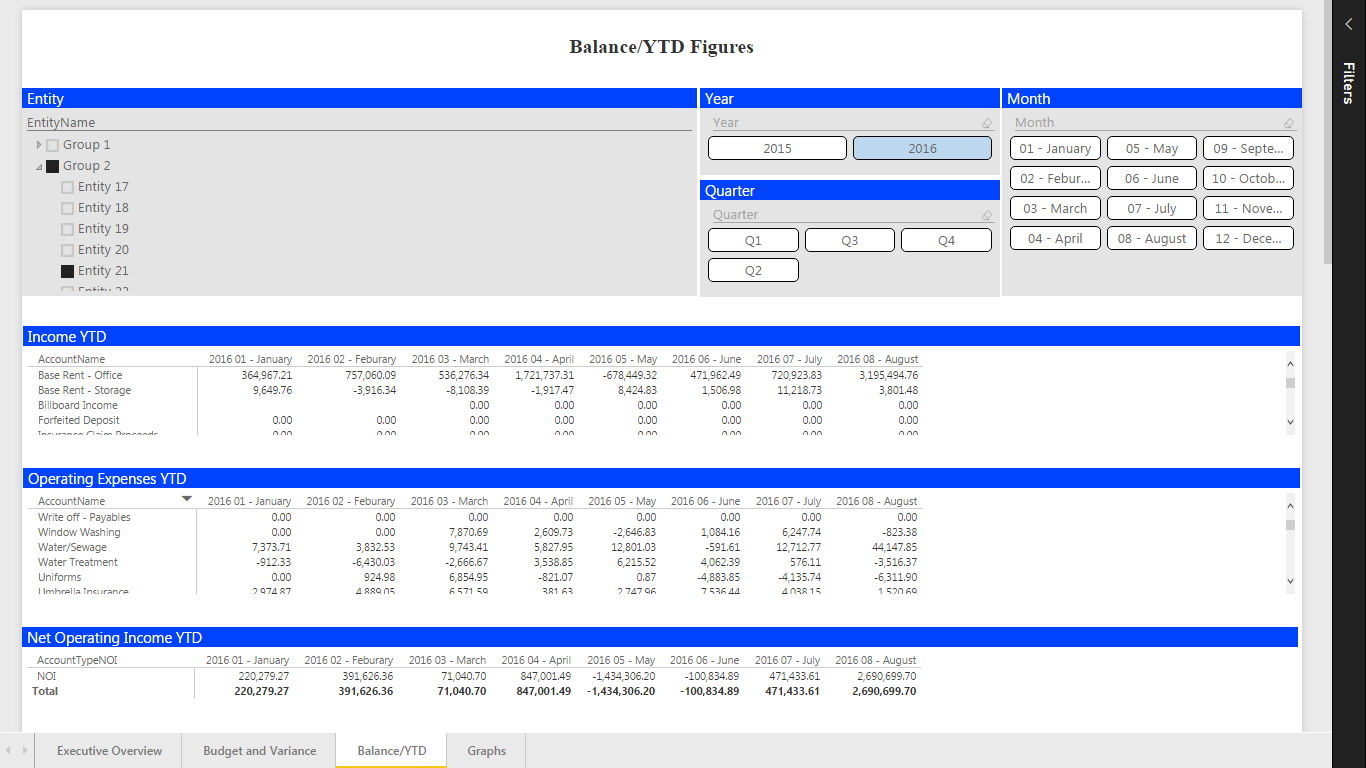
- View high-level reports to get the information you need quickly
- Get more detail by drilling down into individual segments
- Filter by time to compare trends with high-quality graphs and charts
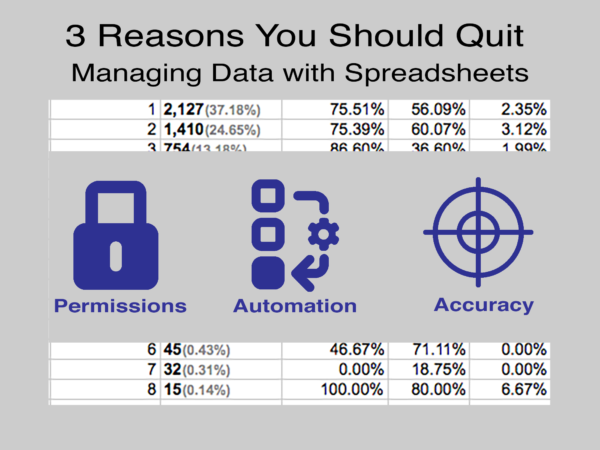
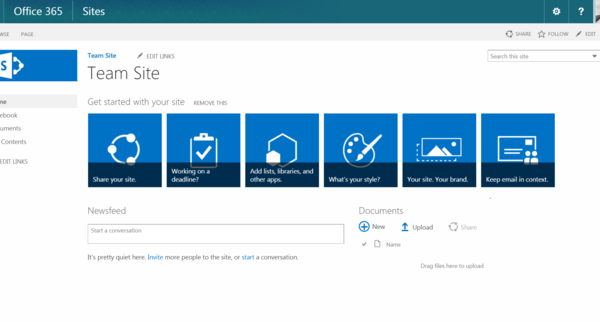
Eliminate Manual Data Entry with Automated SharePoint Financial Reports
- Automated graphs and reporting saves you time and effort
- Set up your data sources and have reports updated automatically
- View reports with graphs and charts that update in real-time
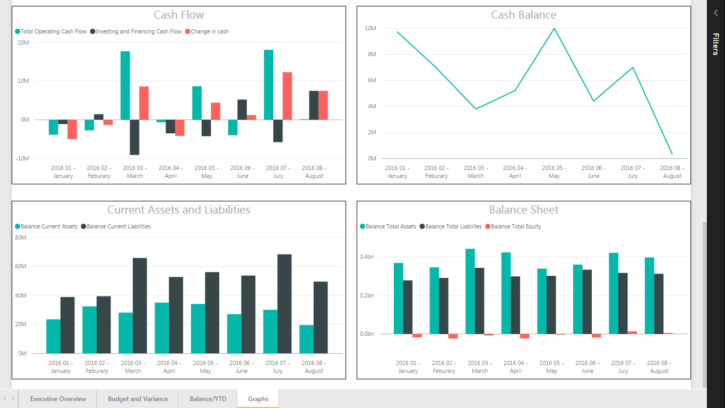
Real-Time Financial Reporting and Instant Data Visualization with SharePoint
- Visualizations are available at the touch of a button
- No more scrolling through long lists of numbers
- Spot trends, compare across entities and periods
- Identify problems and opportunities quickly and easily
HingePoint's Roadmap for a Successful Deployment

Analysis & Scoping
We scope the solution to your specific requirements, budget and timeline. Tailored to you.

Design & Develop
We’ll work with your key stakeholders to create and/or integrate solutions that achieve your business goals.

Test & Deploy
We fully test, secure, and deploy your solution. Training users to maximize adoption and enjoy the benefits.