We believe problems are there to help us grow and find a better way.

Financial Reporting Solutions To...

Sage Financial Reporting Solutions

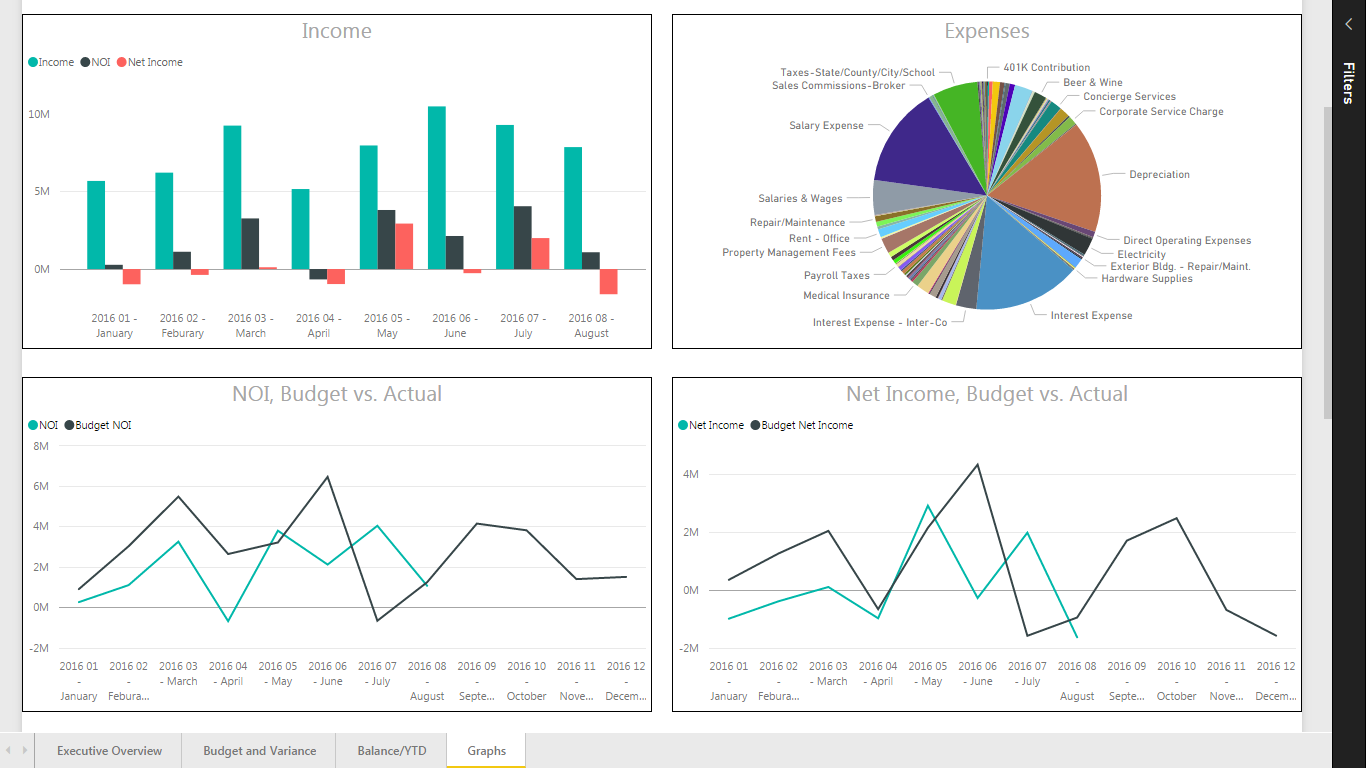
See Trends, Dig Deep

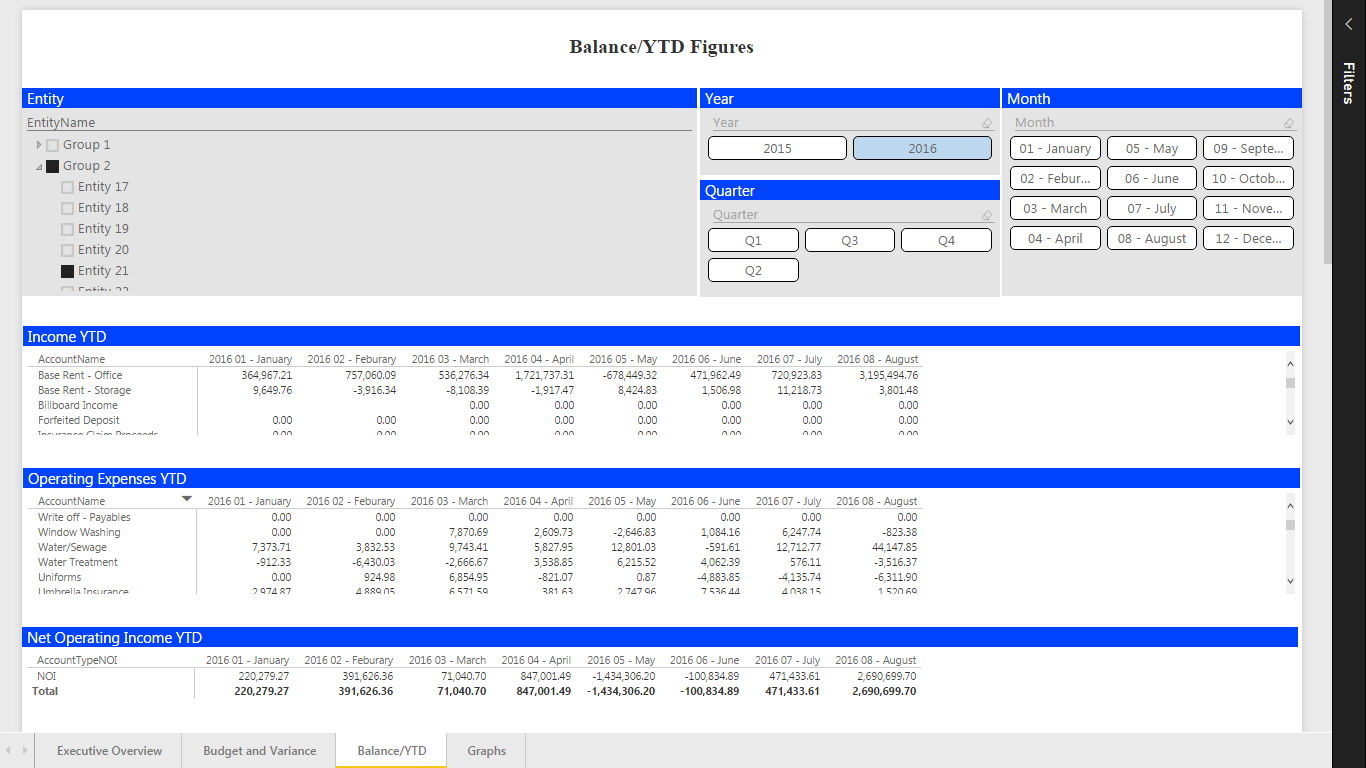
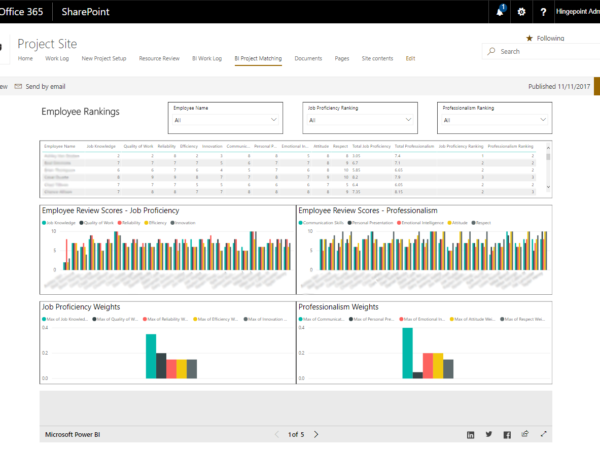
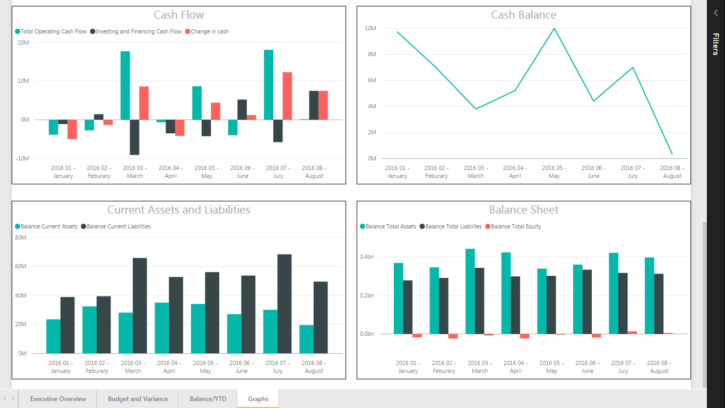
  • View high-level reports to get the information you need quickly
  • Get more detail by drilling down into individual segments
  • Filter by time to compare trends with high-quality graphs and charts
What is Visualization?, Data Visualization, HingePoint, Data Management, Business Intelligence

Eliminate Manual Data Entry

  • Automated graphs and reporting saves you time and effort
  • Set up your data sources and have reports updated automatically
  • View reports with graphs and charts that update in real-time
Sage Financial Reporting Solutions

Report Data Instantly

  • Visualizations are available at the touch of a button
  • No more scrolling through long lists of numbers
  • Spot trends, compare across entities and periods
  • Identify problems and opportunities quickly and easily
  • Harwood International logo
  • Presidio logo
  • Marriott logo
  • Verizon logo
  • Under Armour logo
  • JLL Commercial Real Estate logo
  • InterContinental Hotels Group (IHG) logo
  • HingePoint Logo
  • HingePoint Logo

HingePoint's Roadmap for a Successful Deployment

Data Discover Icon representing HingePoint Software Integration system assessment

Analysis & Scoping

We scope the solution to your specific requirements, budget and timeline. Tailored to you.

Tools icon that represents how HingePoint will create a unique MS Planner/MS Teams platform that achieves your custom business goals

Design & Develop

We’ll work with your key stakeholders to create and/or integrate solutions that achieve your business goals.

trusted icon that represents how HingePoint will make sure your new system is secure and functioning properly to make sure onboarding and adoption go smoothly.

Test & Deploy

We fully test, secure, and deploy your solution. Training users to maximize adoption and enjoy the benefits.
Contact Us »

Financial Dashboard Resources

Contact Us