Are you tired of using outdated workflows that slow down your company?
Outdated workflow systems cause manual data entry errors, incomplete information,…
Read More
Build a Scalable Document Management System with Microsoft Solutions
How to find the right system to manage your documents
Finding the right system to manage…
Read More
Creating a User-Friendly Document Management System with SharePoint
Managing documents in the construction and real estate industries can be…
Read More
Cyber Security Threat-Update
Overview
Current Events – White House, FBI and CIA have confirmed escalating cyber-attacks from Russia and non-state sponsored…
Read More
Microsoft Power BI is a fantastic solution for analytics that helps businesses to extract data and exchange insights within their organizations. It mainly improves…
Read More
Automations, implementation, and flexible frameworks with Microsoft Power Automate
Automations, implementation, flexible frameworks. They all sound great,…
Read More
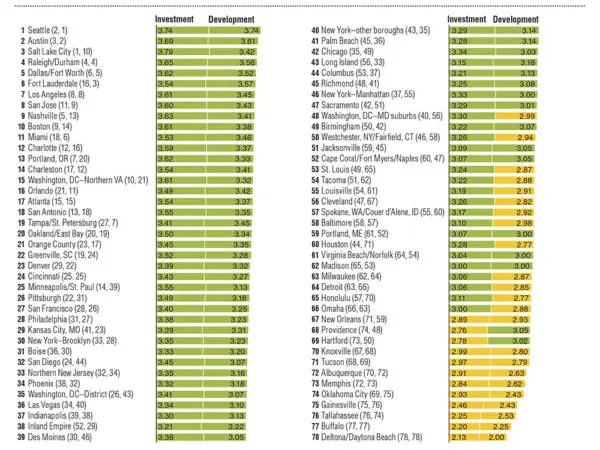
Real Estate Executives focus on replacing outdated systems and the need for cloud and mobile solutions.
Positive year-over-year growth is almost any businesses…
Read More
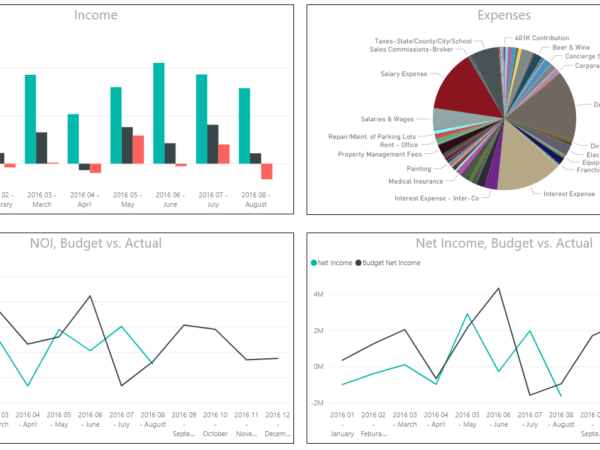
In this Office 365 article you will learn how to enhance how you play the Great Game of Business and get beyond traditional desktop tools like Excel for financial…
Read More