Microsoft Power BI is a fantastic solution for analytics that helps businesses to extract data and exchange insights within their organizations. It mainly improves productivity by showing immediate results.
Using SharePoint without Power BI integration can make business analytics challenging. Doing so is not time-efficient, and it makes it difficult to fetch accurate data. It also lacks reporting visuals that make it easier to see progress. At HingePoint, we make sure you get all the advantages of Microsoft Power BI with a far more tailored approach to power BI consulting.
This tool can be integrated with Microsoft Office 365 applications, which is convenient for all employees since it is commonly the software companies use for data collection, sales reports, presentation, and more. Using immersive data visualizations, organizations can finally track their progress with this platform.
Why do we need Power BI reports and dashboards?
- Data Source (Fetching data in Power BI)
To fetch data from various data source can be the first and foremost challenge that can be faced in Power BI.
Our approach: For fetching data of some of the services that don’t support Power BI integration, we have already used API’s of many services to get data in Power BI. (Only applicable for Services that provide API)
- Data Validation/ Data Structure
Another difficulty that can be faced in Power BI that is faced is Data validation. We need to have proper data structure so that Power BI can use that data appropriately. If the data structure is not as per the requirements there can be issues faced for fetching proper data as per requirements. For example, fetching data from excel that is not as per the appropriate data structure etc.
Our approach: We create data structure that can be directly used in Power BI for making charts.
- Attractive designing (Look and Feel of reports)
This is the Key part for any Microsoft Power BI project. Attractive charts and reports as per the expectations are the foremost need of any clients.
Our approach: We have already created many Power BI charts that uses color combination as per company logos, company specific needs. Bar charts, pie charts, maps, donut charts, and many more are used to make chart look more attractive.
- Easy search and Filter (ease of data viewing)
Filter the data with ease is another specific requirement.
Our approach: We try to maximize use of more filters so user can get ease of accessing more data easily.
5. Auto Refresh (Automatically refreshing charts)
Refreshing the data automatically is one of the challenges that is faced in Power BI.
Our approach: We configure Power BI desktop to provide 8-time refresh per day. Whereas in Power BI Premium has an option of hourly data refresh.
Enhancing Performance with SharePoint + Power BI
The advantages listed above play a significant role in business analytics. They can all be provided with SharePoint and Power BI integration, but with our services, you can get more to optimize Power Bi’s benefits.
With HingePoint, you’ll get accurate data extraction and a more personalized platform complete with company attributes, including a high refresh rate for real-time reporting.
If you have more inquiries or want to get started on enhancing your company’s performance, send us a message. We’re always here to assist you with your business needs.
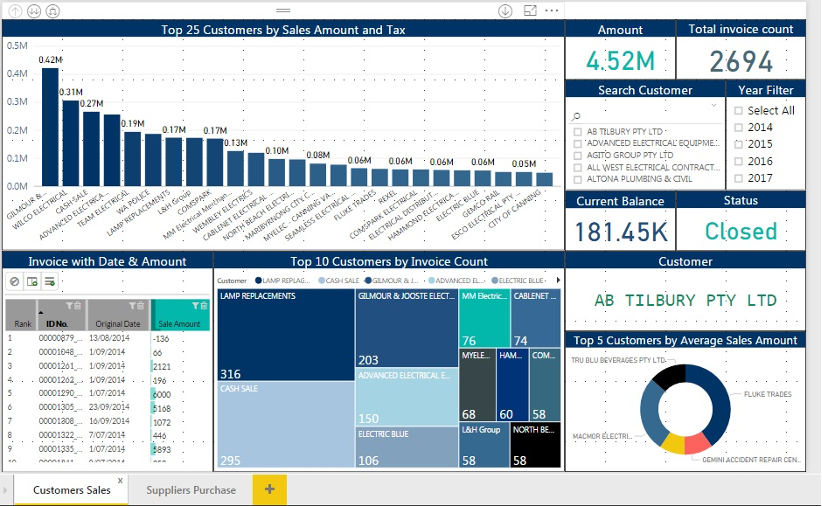
Example Project for Customers and Suppliers purchase and sales.