Instantly get simple, comprehensive views of the financial information you need
Do you spend most of your time finding information to make important decisions? Or do you make decisions with information that automatically reports to you?
HingePoint’s Sage Financial Reporting Solution is like the dashboard of your car. It gives you the business intelligence you need immediately so you can make the best decisions.
When traveling, you should never have to dig to find out how much gas you have and when you need to exit to refill.
The same should be true with your finances. You should not rely on accounting teams, mining lists of financial data or manually entering data to perform the financial analysis you need to make the best decisions.
We bring all your financial data from all your teams, financial reporting software and systems and organize it on one screen with one sign on. That way you can make the best decisions about your business.

See Trends, Dig Deep
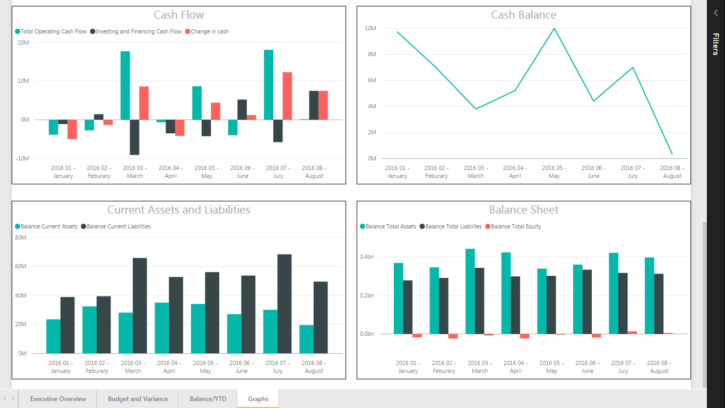
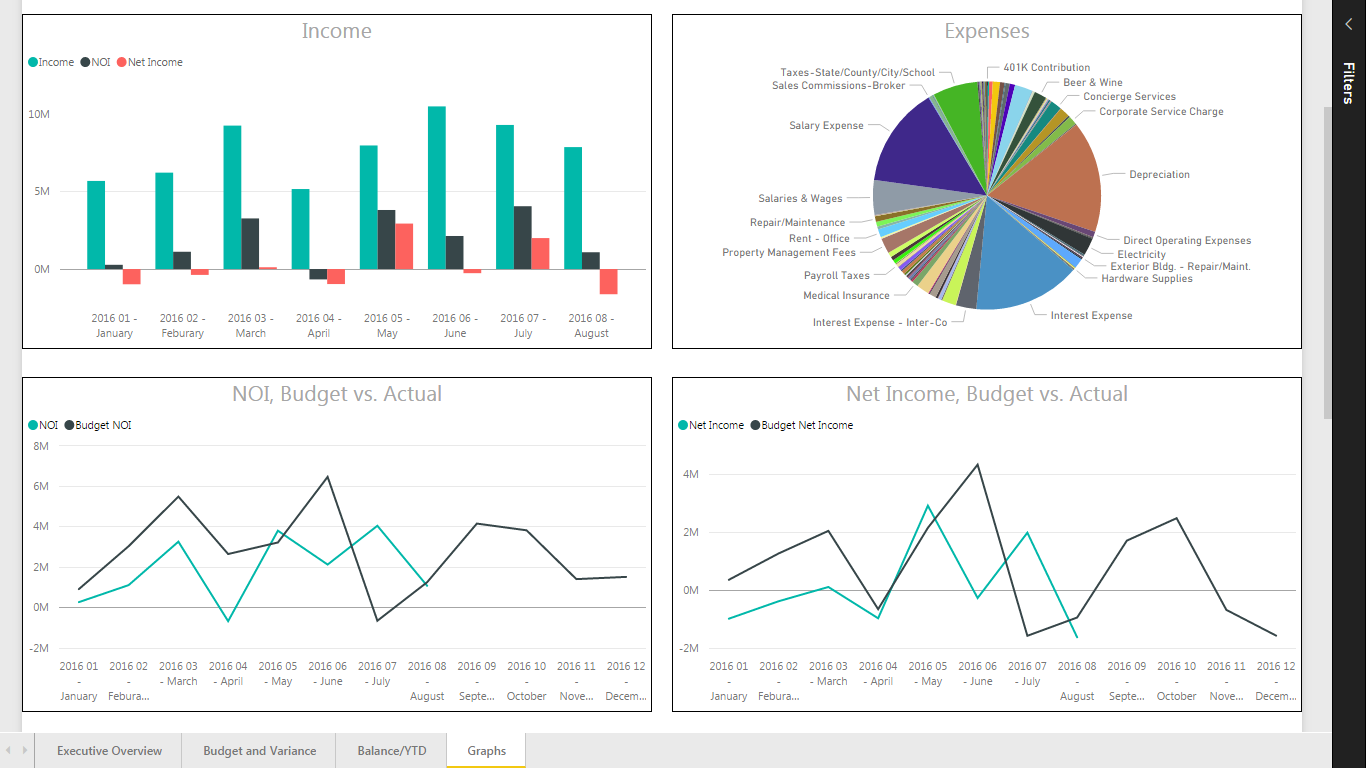
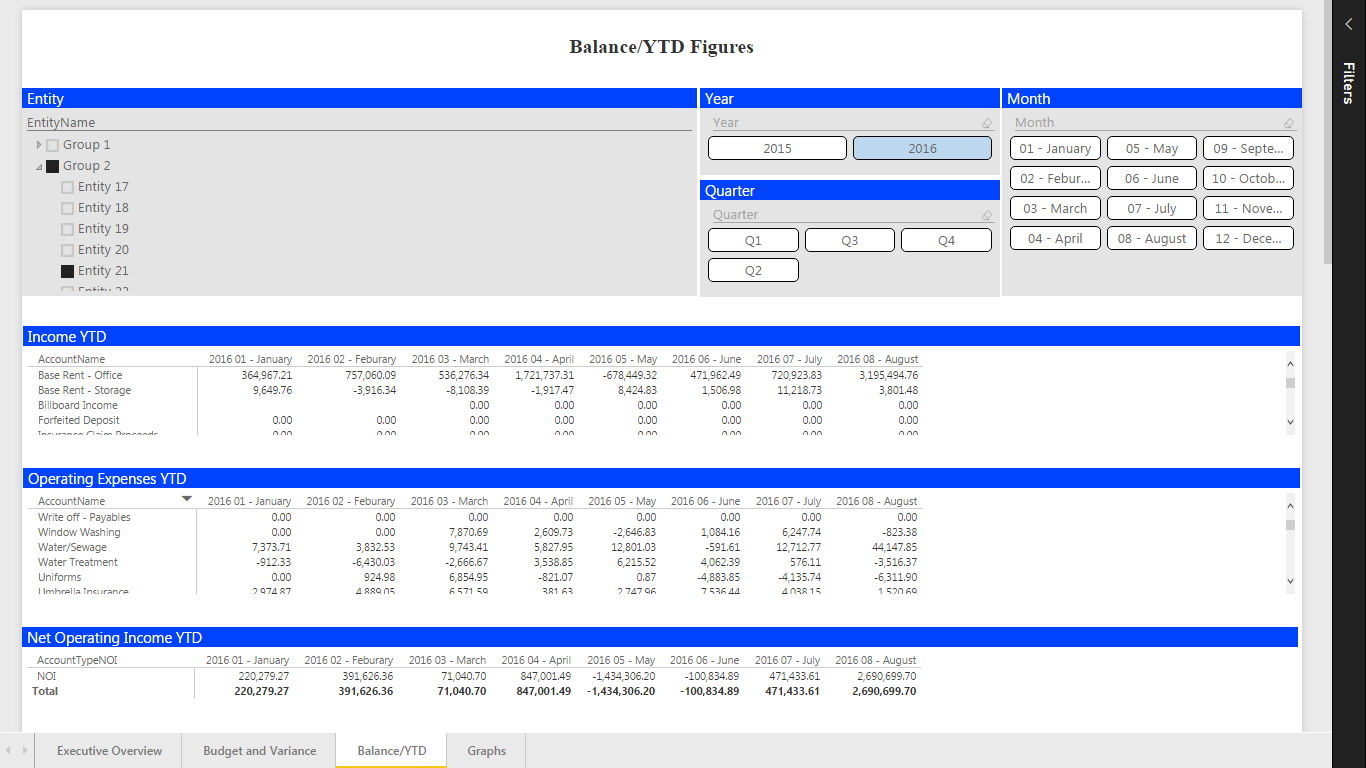
View the performance of the whole company or individual entities within it. Get more detail by drilling down into individual segments. See trends over time with charts showing performance across months, quarters, or years.

Quit Doing it Manually
Automated graphs and reporting saves you time and effort. Instead of manually creating reports, simply load the data into the Financial Dashboard and reports are generated automatically and visually.

Roll Up, Drill Down Portfolios
Visualizations are available at the touch of a button. No more scrolling through long lists of numbers. Spot trends, compare across entities and periods, and identify problems and opportunities quickly and easily.
